Life after MIM UW analysis: making of
I did a Masters in Computer Science at MIM UW in Warsaw, Poland. Many of my fellow alumni have successful careers, both in Poland and abroad. I wanted to know whether this was a statistical phenomenon or just a bias based on the group of my friends. To do so, I ran a survey among MIM graduates to know their fates better.
My anecdata
When my parents (who live in a small town) heard I decided to study computer science, they expected me to become a school teacher or a shopkeeper.
It’s no wonder that I was surprised when seeing other students interning in big companies abroad or getting lucrative jobs after graduation. At the time, it seemed like everyone was getting these internships here or there, with most of the students moving to Silicon Valley for the summer.
During university, I once had a chat with a friend about why the career prospects of graduates aren’t advertised wider so that high-school students know what to expect from a degree. He suggested that, similarly to the surveys about classes we took, it would be enough to ask the alumni about their life after graduation in a survey.
Recently, in the Facebook group of the faculty, there was a discussion about the earnings of the alumni. It reminded me of the chat I had before, and I decided to run the survey we talked about to get to know the data better.
ELA
It is in the best interest of the country/government to provide up-to-date information about different university degrees to allow students-to-be to make an informed decision about their future studies. Because of that, someone created a project called “Ekonomiczne losy absolwentów” (ELA), which provides statistics of the incomes of the alumni of various degrees taught in Poland.
The data comes from a governmental database registering social security contributions, so all (outside of grey economy) workers’ incomes are taken into account. One can see the information here.
There is a catch, though. As it’s a Polish database, it only includes incomes earned in Poland; data of someone who left the country after finishing the degree would not be captured there.
It will likely introduce a bias in the data: people working abroad usually earn higher salaries than those living in Poland. Looking at the data of my year (computer science, 2016), around half of the alumni are present in the data ELA uses.
The survey
To get better coverage of the subjects, I decided to prepare a survey among the alumni. I created an anonymous form using Google Forms and sent the request to fill the survey on the Facebook group of the faculty and the alumni email group.
The survey accepted responses from 17th to 21st July. It asked questions about the salary and about other criteria like gender, size of the city where one was living in, or the number of hours one worked weekly.
Problems with the analysis
Measuring salaries
The biggest problem I encountered while analyzing the data was how to compare the salaries earned in different countries.
The survey asked about the gross salary in the local currency of the country where the person lives. While converting it to a common currency isn’t that big of an issue, averaging the salaries between different countries may give an incomplete view due to varying living costs between countries.
My initial plan was to calculate, for each person, what percentage of the median salary in the given country it earns and then average these. I would get the information that, on average, MIM alumni get 175% of the median salary of their country (fabricated data).
I realized, though, that it’s surprisingly hard to find the data about the median income for lots of countries. The statistic that is more commonly available is the disposable (so net, aka after-tax) income. The salary is usually equivalised for a household (a fancy word meaning that the fact that costs don’t grow linearly with the size of the household is taken into account).
As using median incomes didn’t work out, I found a different concept to help me with cross-country income comparisons: purchasing power parity.
It is a way for modifying the exchange rates between currencies to take into account differing prices such that a unit of a currency can buy the same amount of goods (from a fixed basket). For example, if 2 Polish złotys can buy one bread in Poland, and 1 Swiss franc can buy one bread in Switzerland, the PPP exchange rate would be 2 PLN = 1 CHF, independently of the actual (FOREX) exchange rate between these currencies. In other words, it allows us to express the salaries as “the amount of standardized goods” that one could buy with them and compare these instead.
The exchange rates of national currencies with PPP are available from Eurostat for a wide range of countries.
As with any economic model, PPP comes with assumptions. In our case, when we use PPP to help us average salaries, we assume that the worker spends the money in the same country as the one he earns it in. If a person earns in a high-income country but spends in a low-cost one (as is common with immigrants returning to Poland from Western countries), looking at the earned salary via the lens of goods available in the high-cost country doesn’t make sense, as the worker will be buying these goods cheaper than PPP would estimate.
Monthly salary
In Poland, it’s common to express salary per month. As some of the salaries reported in the survey were significantly below the minimum salary, I suspect these were indeed monthly and not annual salaries.
On the other hand, some of the entries included even lower numbers, below a thousand PLN, suggesting that the salary was given in the thousands, not nominally.
Initially, I planned to allow only numbers >= 10000 in the form to avoid these problems. It turned out, though, that:
- it’s hard to make it work with any currency
- when I set the limit for a short time, some people who don’t work still wanted to put a number here (even though the question was optional). To do so, they were putting the lowest possible number (10000). Using it in the analysis would introduce a bias.
In the end, I allowed any numbers and filtered out the ones lower than the minimum salary.
Year 2019
As I was afraid that the results for the year 2020 would be skewed due to the pandemic (and people, like myself, moving to a different country or getting to work from home), I asked about the salary information from 2019.
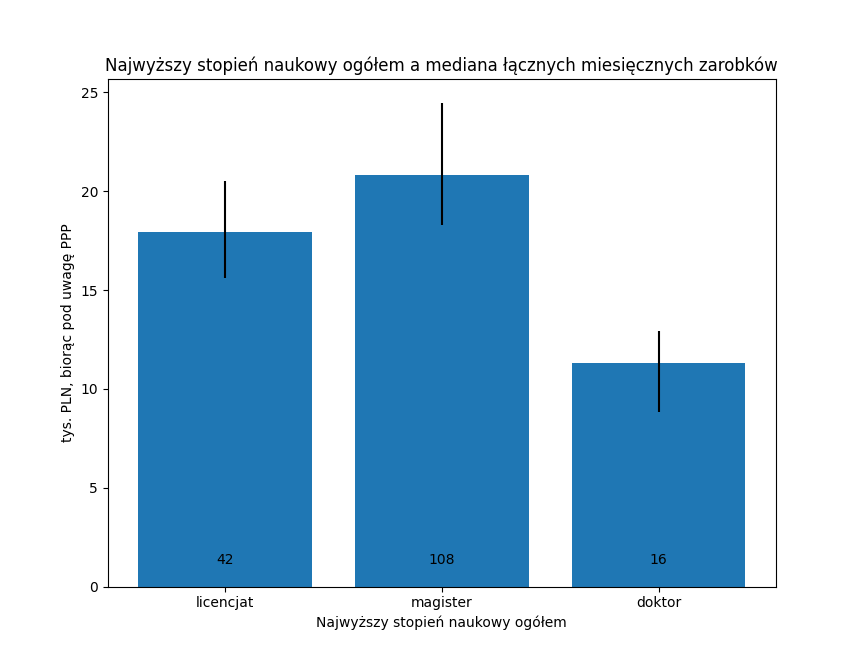
Apart from the salary, the survey asked many other statistical questions, like highest degree finished, which I later used to aggregate data.
Overall, the decision to use 2019 seems a reasonable one. I’m afraid though that people who finished a degree between 2019 and now answered with their salary from before graduation, which would confuse the aggregates a bit.
Distributing the survey
I sent the survey to the student group on Facebook and an alumni email group on 17th July. While people started filling it using the Facebook link immediately, it turned out that the alumni group is censored, and the censor doesn’t work on the weekends, so the email reached the group only on Monday.
I decided to close the survey a couple of days later as I didn’t get as many responses anymore. Because of that, I got a complaint that the survey closed too soon and would be biased towards people who don’t have a life outside of the internet ;)
Final words
I was positively surprised by the number of responses I got: the survey recorded 203 entries. I prepared the analysis of the results (in Polish) and made it available here. The code I used to analyze the data is here.
Unsurprisingly, the data I gathered presented the view of the MIM UW alumni that’s somewhere in-between my biased anecdata (where most of the people move abroad and earn a lot) and the data from ELA. Overall, the data looks reasonable.
It may be worthwhile to repeat the survey in a couple of years.